How Many Replicate Tests are Needed to Test Cookstove Performance and Emissions? – Three is not Always Adequate
Energy for Sustainable Development. 2014, 20. 21-29. link
Abstract
Almost half of the world’s population still cooks on biomass cookstoves of poor efficiency and primitive design, such as three stone fires (TSF). Emissions from biomass cookstoves contribute to adverse health effects and climate change. A number of improved cookstoves with higher energy efficiency and lower emissions have been designed and promoted across the world. During the design development, and for the selection of a stove for dissemination, the stove performance and emissions are commonly evaluated, communicated and compared using the arithmetic average of replicate tests made using a standardized laboratory-based test, commonly the water boiling test (WBT). However, the statistics section of the test protocol contains some debatable concepts and in certain cases, easily misinterpreted recommendations. Also, there is no agreement in the literature on how many replicate tests should be performed to ensure “confidence” in the reported average performance (with three being the most common number of replicates). This matter has not received sufficient attention in the rapidly growing literature on stoves, and yet is crucial for estimating and communicating the performance of a stove, and for comparing the performance between stoves. We illustrate an application using data from a number of replicate tests of performance and emission of the Berkeley–Darfur Stove (BDS) and the TSF under well-controlled laboratory conditions. Here we focus on two as illustrative: time-to-boil and emissions of PM2.5 (particulate matter less than or equal to 2.5 μm in diameter). We demonstrate that an interpretation of the results comparing these stoves could be misleading if only a small number of replicates had been conducted. We then describe a practical approach, useful to both stove testers and designers, to assess the number of replicates needed to obtain useful data from previously untested stoves with unknown variability.
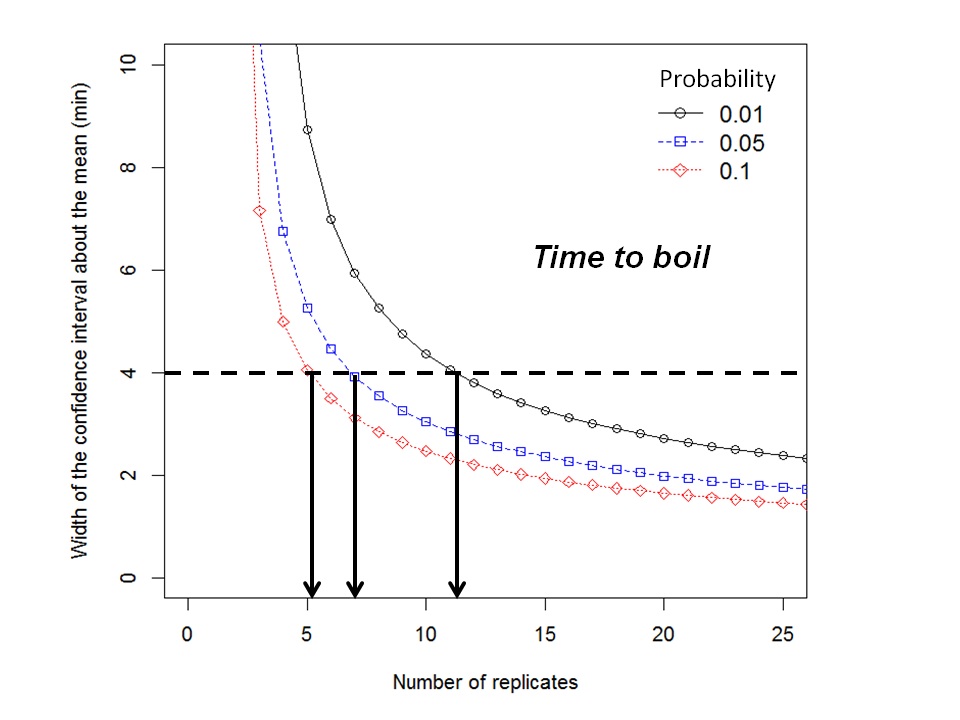
The width of the confidence interval about the mean as a function of the number of replicate tests at three probability levels (0.1, 0.05, and 0.01) for the BDS time to boil data.
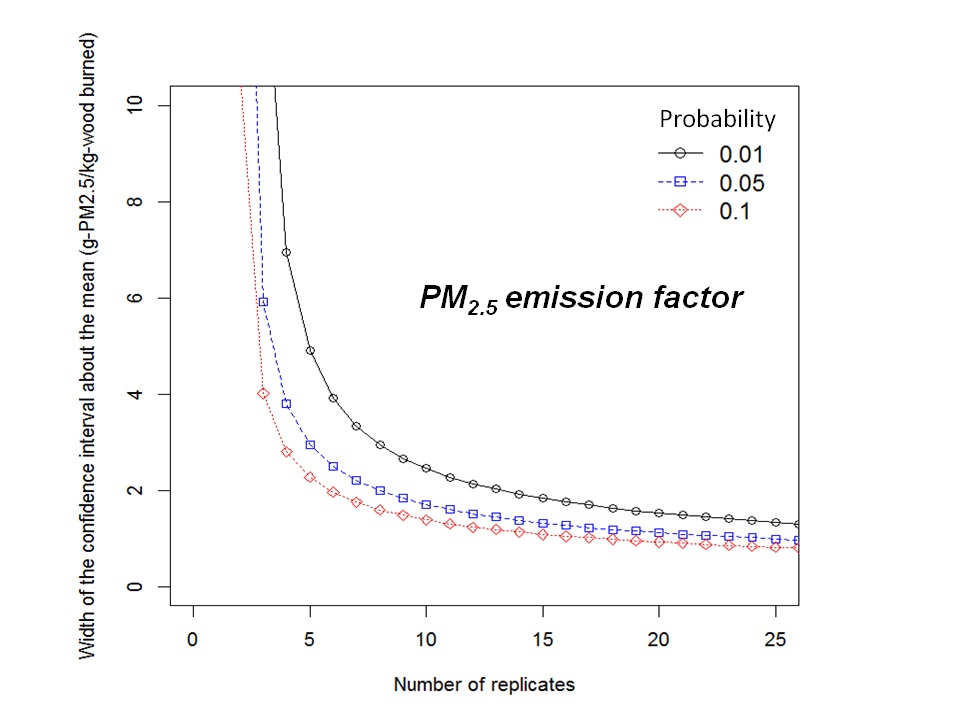
The width of the confidence interval about the mean as a function of the number of replicate tests at three probability levels (0.1, 0.05, and 0.01) for the BDS PM2.5 emission factor data.
A Ten-Year Source Apportionment Study of Ambient Fine Particulate Matter in San Jose, California
Atmospheric Pollution Research. 2013, 4, 398-404. link
Fine particulate matter (PM2.5) composition data from the Speciation Trends Network (STN) site in San Jose, CA, were analyzed by positive matrix factorization (PMF) using U.S. Environmental Protection Agency (EPA) PMF version 5.0. These data were 24-h average mass concentrations and compositions obtained from samples taken every third day from October 2002 to February 2012. The eight identified sources include secondary sulfate, secondary nitrate, fresh sea salt, aged sea salt, diesel emission, road salt, gasoline vehicles, and wood combustion. The contributions to PM2.5 of these eight sources were 13.1%, 20.0%, 5.5%, 7.8%, 9.4%, 5.1%, 14.8, and 24.3%, respectively. The Ni-related industrial source, which was detected in previous PMF analysis, was not identified in our study and a sharp decrease in Ni concentrations was observed after the end of 2004. The contribution of road dust source decreased significantly after 2004 (Mann-Whitney test, p<0.01), which is probably the result of the city wide enhanced street sweeping programs starting in 2005. A 40% reduction in the wood combustion PM2.5 contribution between winter 2008 and winter 2009 was found. This decrease could be attributed to the San Francisco Bay Area Air Quality Management District (BAAQMD) wood burning rule implemented in July 2008. In the future, the effectiveness and benefits of the wood burning rule could be evaluated using the multi-wavelength aethalometer delta-c method.
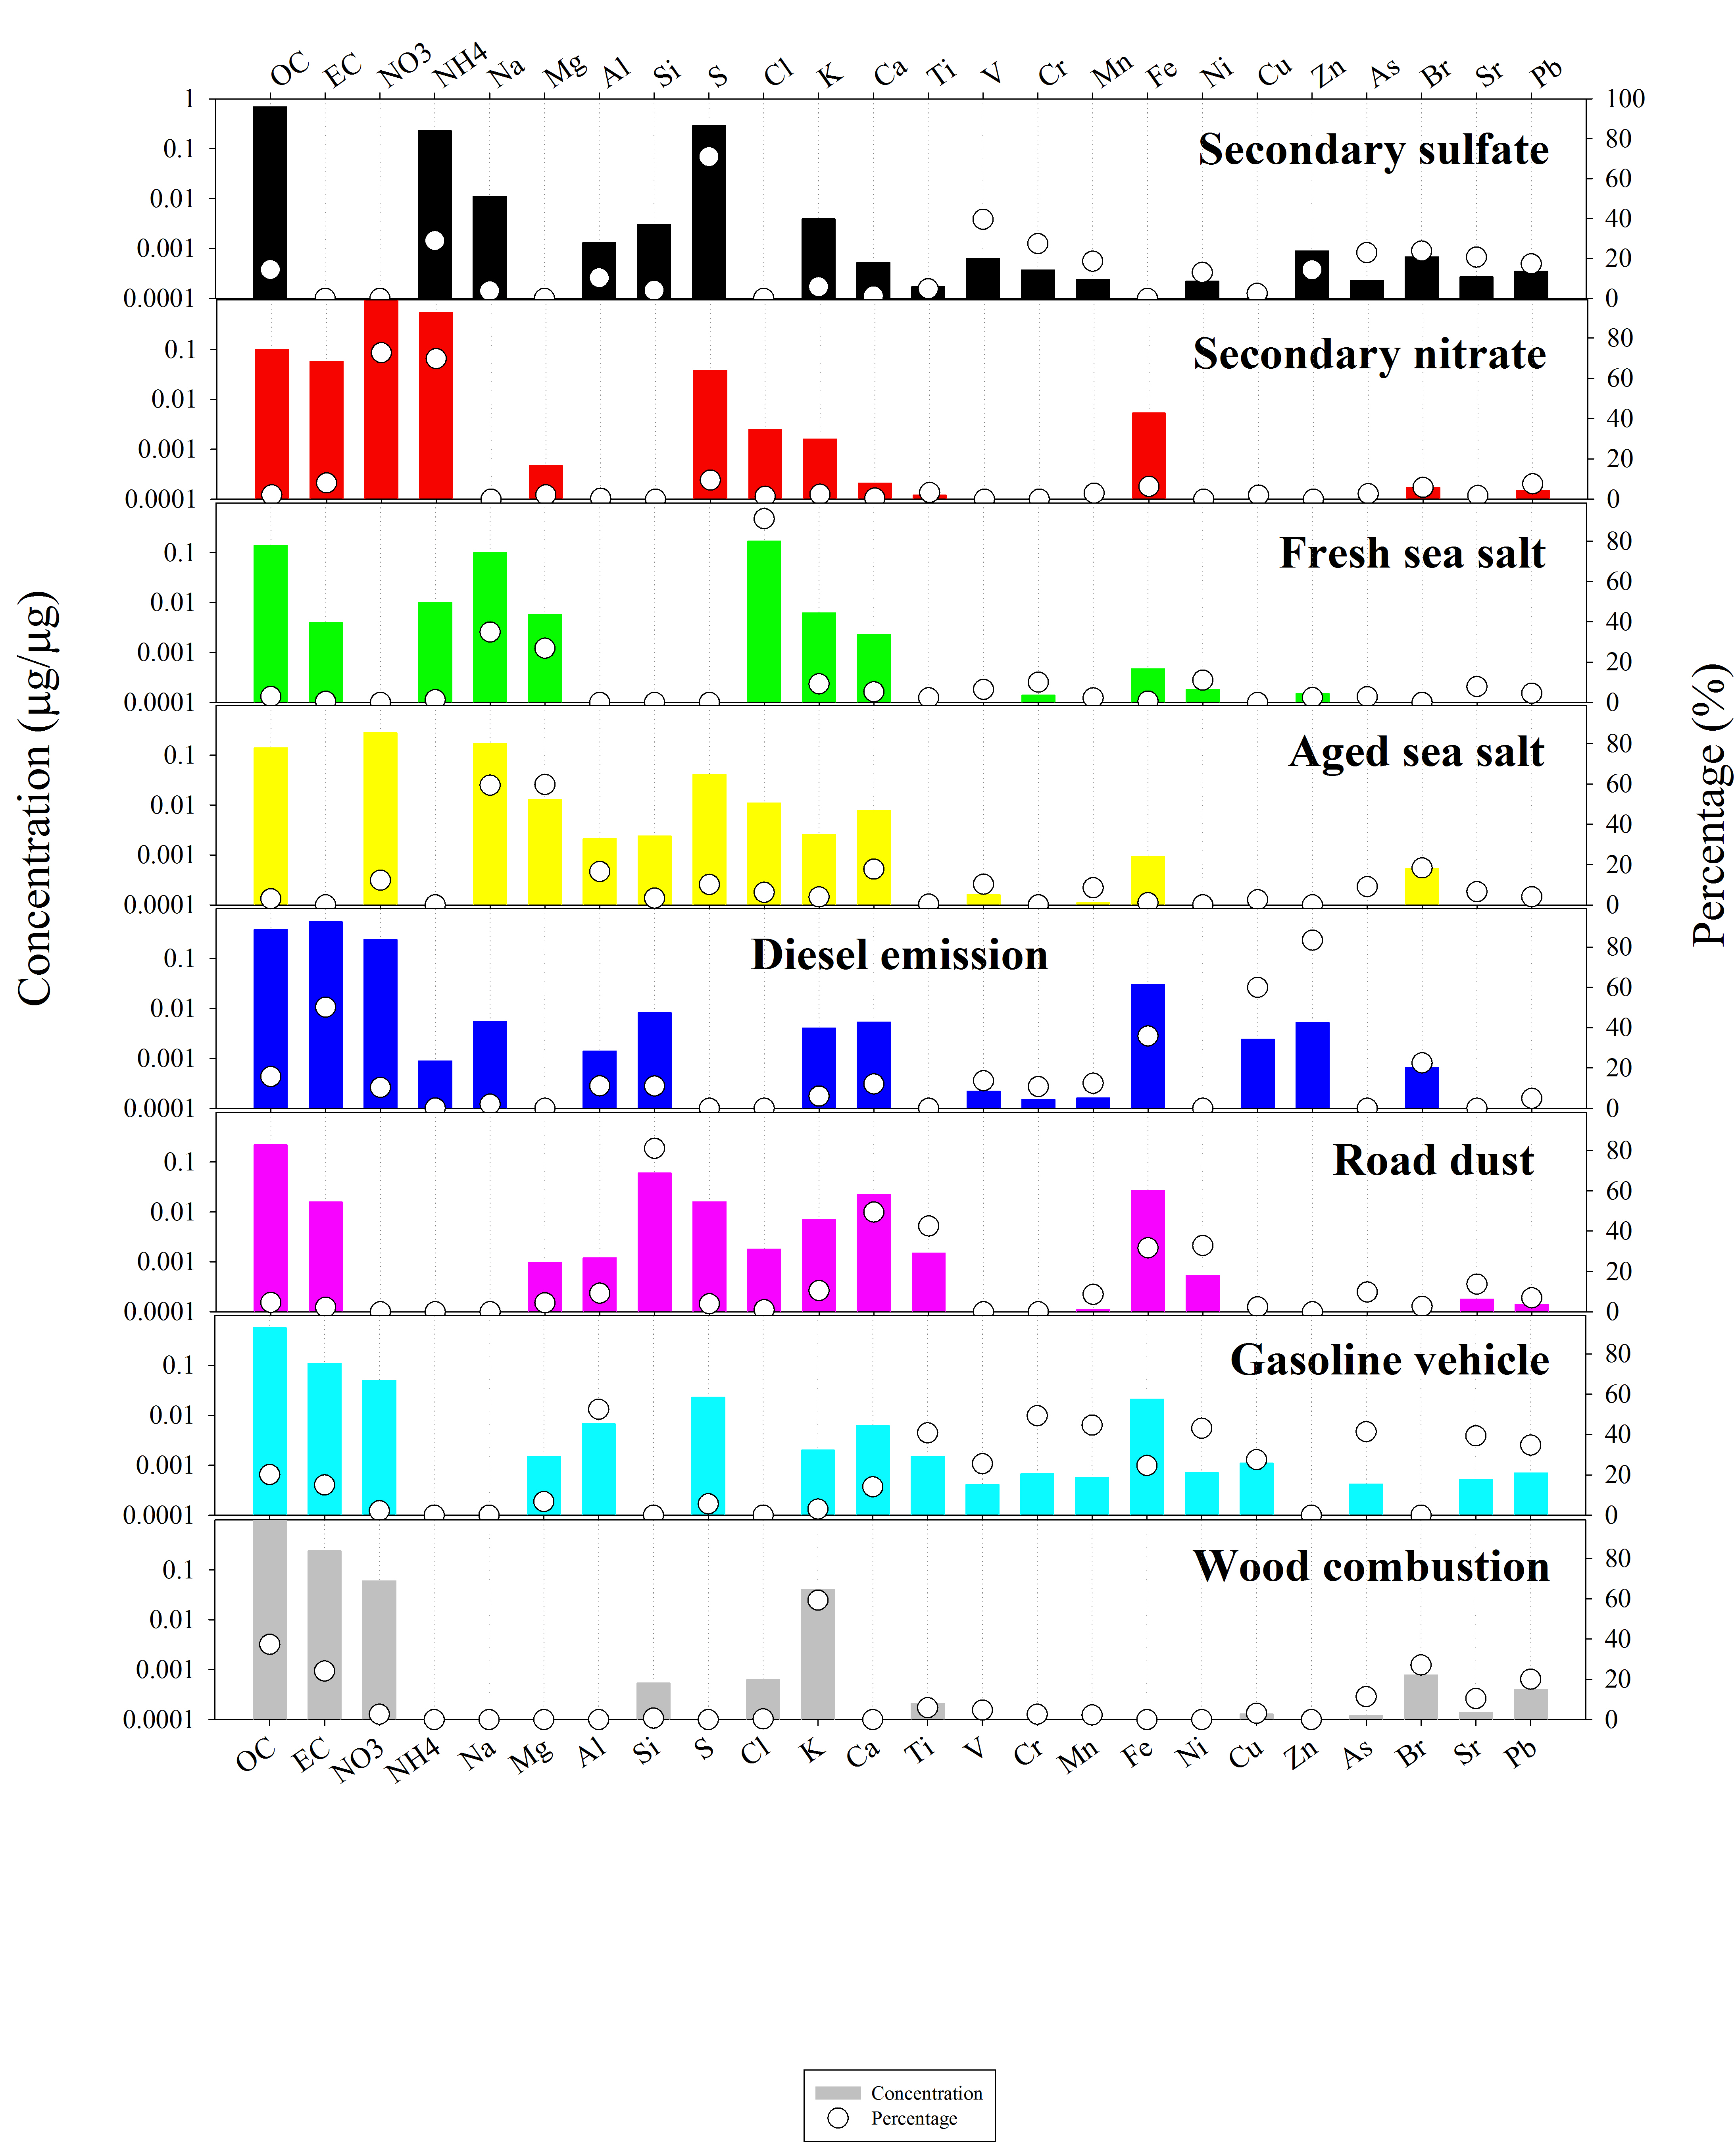
The source profiles (bars represent mass contribution, y– axis on the left, white dots
represent contribution in percentage, y–axis on the right).

Annual variation of source contributions to total PM2.5 in mass (top) and percentage (bottom).
Error bars represent one standard deviation.
Effect of the Shutdown of a Large Coal-Fired Power Plant on Ambient Mercury Species
Chemosphere. 2013, 92 (4): 360–367. link
Abstract
In the spring of 2008, a 260 MWe coal-fired power plant (CFPP) located in Rochester, New York was closed over a 4-month period. Using a 2-year data record, the impacts of the shutdown of the CFPP on nearby ambient concentrations of three Hg species were quantified. The arithmetic average ambient concentrations of gaseous elemental mercury (GEM), gaseous oxidized mercury (GOM), and particulate mercury (PBM) during December 2007–November 2009 were 1.6 ng m−3, 5.1 pg m−3, and 8.9 pg m−3, respectively. The median concentrations of GEM, GOM, and PBM significantly decreased by 12%, 73%, and 50% after the CFPP closed (Mann–Whitney test, p < 0.001). Positive Matrix Factorization (EPA PMF v4.1) identified six factors including O3-rich, traffic, gas phase oxidation, wood combustion, nucleation, and CFPP. When the CFPP was closed, median concentrations of GEM, GOM, and PBM apportioned to the CFPP factor significantly decreased by 25%, 74%, and 67%, respectively, compared to those measured when the CFPP was still in operation (Mann–Whitney test, p < 0.001). Conditional probability function (CPF) analysis showed the greatest reduction in all three Hg species was associated with northwesterly winds pointing toward the CFPP. These changes were clearly attributable to the closure of the CFPP.

Source profile – The contribution percentage of each factor to the pollutants concentrations
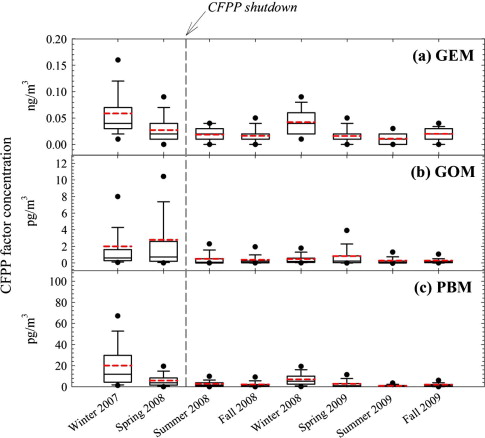
Seasonal variations of contributions of the CFPP factor to GEM, GOM, and PBM.

Comparison of the directionalities of the CFPP factor contributions to the GEM, GOM, and PBM.
Modeling Multi-Scale Aerosol Dynamics and Micro-Environmental Air Quality Near a Large Highway Intersection Using the CTAG Model
Science of the Total Environment. 2013, 443: 375-386. linkAbstract
A new methodology, referred to as the multi-scale structure, integrates “tailpipe-to-road” (i.e., on-road domain) and “road-to-ambient” (i.e., near-road domain) simulations to elucidate the environmental impacts of particulate emissions from traffic sources. The multi-scale structure is implemented in theCTAG model to (1) generate process-based on-road emission rates of ultrafine particles (UFPs) by explicitly simulating the effects of exhaust properties, traffic conditions, and meteorological conditions and (2) to characterize the impacts of traffic-related emissions on micro-environmental air quality near a highway intersection in Rochester, NY. The performance of CTAG, evaluated against with the field measurements, shows adequate agreement in capturing the dispersion of carbon monoxide (CO) and the number concentrations of UFPs in the near road micro-environment. As a proof-of-concept case study, we also apply CTAG to separate the relative impacts of the shutdown of a large coal-fired power plant (CFPP) and the adoption of the ultra-low-sulfur diesel (ULSD) on UFP concentrations in the intersection micro-environment. Although CTAG is still computationally expensive compared to the widely-used parameterized dispersion models, it has the potential to advance our capability to predict the impacts of UFP emissions and spatial/temporal variations of air pollutants in complex environments. Furthermore, for the on-road simulations, CTAG can serve as a process-based emission model; Combining the on-road and near-road simulations, CTAG becomes a “plume-in-grid” model for mobile emissions. The processed emission profiles can potentially improve regional air quality and climate predictions accordingly.
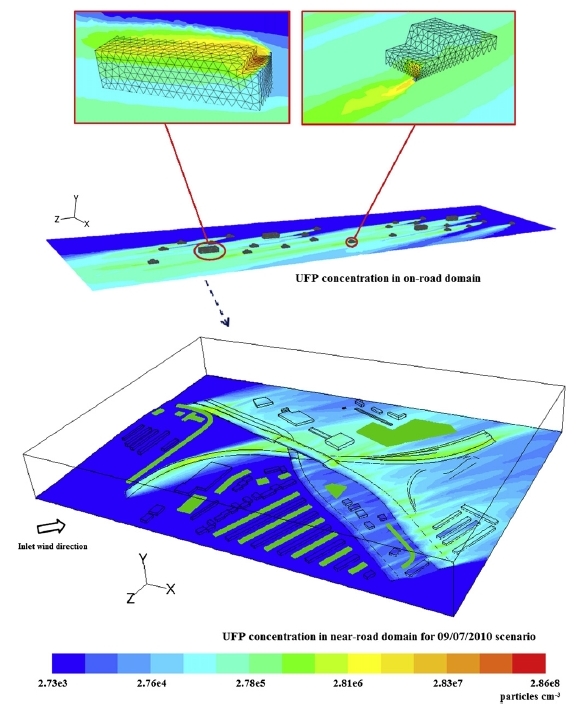
Time-averaged distributions of UFPs simulated by CTAG with the implementation of multi-scale structure.
Source Apportionment of Airborne Particulate Matter using Inorganic and Organic Species as Tracers
Atmospheric Environment. 2012, 55: 525-532. linkAbstract
Source apportionment is typically performed on chemical composition data derived from particulate matter (PM) samples. However, many common sources no longer emit significant amounts of characteristic trace elements requiring the use of more comprehensive chemical characterization in order to fully resolve the PM sources. Positive matrix factorization (EPA PMF, version 4.1) was used to analyze 24-hr integrated molecular marker (MM), secondary inorganic ions, trace elements, carbonaceous species and light absorption data to investigate sources of PM2.5 in Rochester, New York between October 2009 and October 2010 to explore the role of specific MMs. An eight-factor solution was found for which the factors were identified as isoprene secondary organic aerosol (SOA), airborne soil, other SOA, diesel emissions, secondary sulfate, wood combustion, gasoline vehicle, and secondary nitrate contributing 6.9%, 12.8%, 3.7%, 7.8%, 45.5%, 9.1%, 7.9%, and 6.3% to the average PM2.5 concentration, respectively. Concentrations of pentacosane, hexacosane, heptacosane, and octacosane in the gasoline vehicles factor were larger compared to diesel emissions. Aethalometer delta-C was strongly associated with wood combustion. The compounds, n-heptacosanoic acid and n-octacosanoic acid, occasionally used in the past as tracers for road dust, were found to largely associate with SOA in this study. In comparison with a standard PMF analyses without MM, inclusion of them was necessary to resolve SOA and wood combustion factors in urban areas.

TE-PUF poly-urethane foam high volume air sampler
Multiple Year Black Carbon Measurement and Source Apportionment using Delta-C in Rochester, NY
Journal of Air & Waste Management Association. 2012, 62 (8): 880-887. linkAbstract
Black carbon (BC), an important component of the atmospheric aerosol, has climatic, environmental, and human health significance. In this study, BC was continuously measured using a two-wavelength aethalometer (370 nm and 880 nm) in Rochester, New York from January 2007 to December 2010. The monitoring site is adjacent to two major urban highways (I-490 and I-590), where 14% to 21% of the total traffic were heavy-duty diesel vehicles. The annual average BC concentrations were 0.76 μg/m3, 0.67 μg/m3, 0.60 μg/m3, and 0.52 μg/m3 in 2007, 2008, 2009, and 2010, respectively. Positive matrix factorization (PMF) modeling was performed using PM2.5 elements, sulfate, nitrate, ammonia, elemental carbon (EC), and organic carbon (OC) data from the U.S. EPA speciation network and delta-C (UVBC370nm – BC880nm) data. Delta-C has been previously shown to be a tracer of wood combustion factor. It was used as an input variable in source apportionment models for the first time in this study and found to play an important role in separating traffic (especially diesel) emissions from wood combustion emissions. The result showed the annual average PM2.5 concentrations apportioned to diesel emissions in 2007, 2008, 2009, and 2010 were 1.34 μg/m3, 1.25 μg/m3, 1.13 μg/m3, and 0.97 μg/m3, respectively. The BC conditional probability function (CPF) plots show a large contribution from the highway diesel traffic to elevated BC concentrations. The measurements and modeling results suggest an impact of the U.S EPA 2007 Heavy-Duty Highway Rule on the decrease of BC and PM2.5 concentrations during the study period.

PMF source profiles
Are Ambient Ultrafine, Accumulation Mode, and Fine Particles Associated With Adverse Cardiac Responses in Patients Undergoing Cardiac Rehabilitation?
Environmental Health Perspectives. 2012, 120 (8): 1162-1169. linkAbstract
Background: Mechanisms underlying previously reported air pollution and cardiovascular (CV) morbidity associations remain poorly understood.
Objectives: We examined associations between markers of pathways thought to underlie these air pollution/CV associations and ambient particle concentrations in post-infarction patients.
Methods: We studied 76 patients, from June 2006 to November 2009, participating in a 10-week cardiac rehabilitation program following a recent (within 3 months) myocardial infarction or unstable angina. Ambient ultrafine particle (UFP; 10 to 100 nm), accumulation mode particle (AMP; 100-500nm), and fine particle concentrations (PM2.5) were monitored continuously. Continuous holter electrocardiogram (ECG) recordings were made before and during supervised, graded, twice weekly, exercise sessions. A venous blood sample was collected and blood pressure was measured before sessions.
Results: Using mixed effects models, we observed adverse changes in rMSSD (square root of the mean of the sum of the squared differences between adjacent NN intervals), SDNN (standard deviation of all normal to normal beat intervals), TpTe (Time from peak to end of T-wave), heart rate turbulence, systolic and diastolic blood pressures, C-reactive protein, and fibrinogen associated with interquartile range increases in UFP, AMP, and PM2.5 at 1 or more lag times within the previous 5 days. Exposures were not associated with MeanNN, QTc (QT interval duration corrected for heart rate), deceleration capacity, and white blood cell count were not associated with UFP, AMP, and PM2.5 at any lag time.
Conclusions: In cardiac rehabilitation patients, particles were associated with subclinical decreases in parasympathetic modulation, prolongation of late repolarization duration, increased blood pressure, and systemic inflammation. It is possible that such changes could increase the risk of cardiovascular events in this susceptible population.

Cardiac rehabilitation center
A New Indicator of Fireworks Emissions in Rochester, New York
Environmental Monitoring and Assessment. 2012, 184 (12): 7293-7297. linkAbstract
In ambient particle source apportionment studies, data for holidays such as July 4 (US Independence Day) are normally removed because of the high concentrations of chemical species and unusually high particle mass concentrations that are due to fireworks. Many cultures celebrate events with fireworks. A near real-time measurement that could indicate fireworks would be useful in indicating their impact on air quality. Commonly monitored ambient pollutants include PM2.5, CO, SO2, O3, 10–500-nm particle number, and black carbon (BC). Using a two-wavelength aethalometer, another parameter, delta-C (UVBC370 nm–BC880 nm, aethalometer), can be calculated. These variables were continuously monitored during July 1–7, 2005–2010, in Rochester, New York. High delta-C values are normally associated with biomass combustion particles. However, statistically higher delta-C values were observed on Independence Day compared to the other period. Back trajectory analysis showed transport of local fireworks smoke to the sampling site on the night of July 4. An enhanced correlation between delta-C and BC during the fireworks episodes suggests changes from the usual BC sources. Fireworks emissions changed the ambient carbonaceous particulate species during these intervals. The delta-C value was found to be a readily measured indicator of fireworks emissions during periods when wood combustion was not likely to be present and provides a tool for monitoring such emissions where they might be more common such as amusement parks.

Daily variations of delta-C values during 2008-2010

Clouds of firework smoke
Urban-Scale Seasonal and Spatial Variability of Ultrafine Particle Number Concentrations
Water, Air, & Soil Pollution. 2012, 223 (5), 2223-2235. linkAbstract
In epidemiological studies, ultrafine particle (UFP) data from a single monitoring site are generally used as a measure of population exposure potentially resulting in exposure misclassification. From August 2009 to October 2010, 1-week campaigns were conducted during each season. The temporal and spatial variations of UFP number size distributions were investigated at 12 monitoring sites distributed across a 9 × 9 km urban area in Rochester, New York using a Fast Mobility Particle Sizer spectrometer. The overall average number concentrations of 5.6- to 560-nm particles in summer, winter, spring, and fall were 9,025, 10,939, 4,955, and 14,485/cm3, respectively. Coefficients of divergence and correlation coefficients were calculated between site pairs to assess the spatial heterogeneity in the particle number size distributions. Moderate spatial divergence and uniform temporal variation were found for the chosen sites. Elevated UFP number concentrations were observed near highways, off-road diesel engines, and residential wood combustion sources, indicating significant contributions to the UFP exposure of people living adjacent to these sources. Our results suggest that one stationary monitoring site may not represent the actual human UFP exposure over a whole urban area.

Locations of the sampling sites in Rochester

Clarkson’s Mobile Air Pollution Lab (MAPL)
Long-Term Study of Urban Ultrafine Particles and Other Pollutants
Atmospheric Environment. 2011, 45 (40), 7672-7680. linkAbstract
Continuous measurements of number size distributions of ultrafineparticles (UFPs) and otherpollutants (PM2.5, SO2, CO and O3) have been performed in Rochester, New York since late November 2001. The 2002–2009 average number concentrations of particles in three size ranges (10–50 nm, 50–100 nm and 100–500 nm) were 4,730 /cm3, 1,838 /cm3, and 1,073/cm3, respectively. The lowest annual average number concentrations of particles in 10–50 nm and 50–100 nm were observed during 2008–2009. The lowest monthly average number concentration of 10–50 nm particles was observed in July and the highest in February. The daily patterns of 10–50 nm particles had two peaks at early morning (7–8 am) and early afternoon (2 pm). There was a distinct declining trend in the peak number concentrations from 2002–2005 to 2008–2009. Large reductions in SO2 concentrations associated with northerly winds between 2007 and 2009 were observed. The most significant annual decrease in the frequency of morning particle nucleation was observed from 2005 to 2007. The monthly variation in the morning nucleation events showed a close correlation with number concentrations of 10–50 nm particles (r = 0.89). The frequency of the local SO2-related nucleation events was much higher before 2006. All of these results suggest significant impacts of highway traffic and industrial sources. The decrease in particle number concentrations and particle nucleation events likely resulted from a combination of the U.S. EPA 2007 Heavy-Duty Highway Rule implemented on October 1, 2006, the closure of a large coal-fired power plant in May 2008, and the reduction of Eastman Kodak emissions.

Rochester NYSDEC monitoring site

Bird’s-eye view of downtown Rochester
Characterization of Residential Wood Combustion Particles Using the Two-Wavelength Aethalometer
Environmental Science & Technology. 2011, 45 (17), 7387-7393. linkAbstract
In the United States, residential wood combustion (RWC) is responsible for 7.0% of the national primary PM2.5 emissions. Exposure to RWC smoke represents a potential human health hazard. Organic components of wood smoke particles absorb light at 370 nm more effectively than 880 nm in two-wavelength aethalometer measurements. This enhanced absorption (delta-C = BC370 nm – BC880 nm) can serve as an indicator of RWC particles. In this study, aethalometer delta-C data along with measurements of molecular markers and potassium in PM2.5 were used to identify the presence of airborne RWC particles in Rochester, NY. The aethalometer data were corrected for the loading effect. Delta-C was found to strongly correlate with wood smoke markers (levoglucosan and potassium) during the heating season. No statistically significant correlation was found between delta-C and vehicle exhaust markers. The delta-C values were substantially higher during winter compared to summer. The winter diurnal pattern showed an evening peak around 21:00 that was particularly enhanced on weekends. A relationship between delta-C and PM2.5 was found that permits the estimation of the contribution of RWC particles to the PM mass. RWC contributed 17.3% to the PM2.5 concentration during the winter. Exponential decay was a good estimator for predicting delta-C concentrations at different winter precipitation rates and different wind speeds. Delta-C was also sensitive to remote forest fire smoke.

Correlation between delta-C and levoglucosan during winter
Urban-Scale Spatial-temporal Variability of Black Carbon and Winter Residential Wood Combustion Particles
Aerosol and Air Quality Research. 2011, 11, 473-481. linkAbstract
It has been suggested that certain organic aerosol components of wood smoke have enhanced ultraviolet absorption at 370 nm relative to 880 nm in two-wavelength aethalometer black carbon (BC) measurements. This enhanced absorption could serve as an indicator of wood combustion particles (delta-C = UVBC370nm – BC880nm). From August 2009 to October 2010, week-long mobile monitoring campaigns were conducted during each season in Rochester, New York. The temporal and spatial variations of BC and delta-C were investigated at twelve monitoring sites. A portable two-wavelength aethalometer housed in Clarkson’s Mobile Air Pollution Lab was used for data collection. The average BC concentrations were 0.94 µg/m3, 0.68 µg/m3, 0.47 µg/m3, and 0.81 µg/m3 in summer, winter, spring, and fall, respectively. BC and delta-C hotspots were identified. Coefficients of divergence (COD) and correlation coefficients (r) were calculated between site pairs to assess the spatial and temporal heterogeneity. High spatial divergence but uniform temporal variation in BC were found for these sites. Winter residential wood combustion (RWC) particles exhibited high spatial heterogeneity as well. In epidemiological studies, BC particles data from a central monitoring site are generally used as the basis in population exposure estimation. These results suggest that one central monitoring site may not adequately represent the actual BC and RWC particle exposure over a whole urban area.

Contour plots of winter delta-C values
Effect of the Shutdown of a Coal-Fired Power Plant on Urban Ultrafine Particles and Other Pollutants
Aerosol Science and Technology. 2011, 45 (10), 1245–1249. linkAbstract
Ultrafine particle (UFP) monitoring over the size range of 10–500 nm has been ongoing in Rochester, New York, since November 2001. A nearby large coal-fired power plant (CFPP) was shut down in the spring of 2008 for conversion to natural gas combustion. This shutdown resulted in a reduction in observed concentrations of UFP number and other pollutants. In this study, positive matrix factorization (PMF) model and conditional probability function (CPF) were used to elicit the CFPP source information based on 2005–2010 hourly concentration data of particles and gaseous species and meteorological variables. Five factors were identified, i.e., nucleation, regional transport, traffic, CFPP, and O3-rich secondary aerosol that influenced the measured pollution levels. The average 10–50 nm, 50–100 nm, and 100–500 nm particle number concentrations decreased 49.8%, 51.9%, and 52.9% from 2007 to 2008, respectively. The annual average SO2, CO, and PM2.5 concentrations also decreased by 64.1%, 39.6%, and 45.6% from 2007 to 2008, respectively. The largest reductions of 10–50 nm particles, CO, and SO2 concentrations between 2007 and 2009 were observed with northerly winds. These changes were clearly attributed to the shutdown of the large CFPP in the study area.

Annual variations of contributions of the CFPP to various pollutants

Comparison of the directionalities of the CFPP factor contributions
Characterization of Ambient Black Carbon and Wood Burning Particles in Two Urban Areas
Journal of Environmental Monitoring. 2011, 13, 1919-1926. linkAbstract
Previously it has been suggested that certain organic aerosol components of wood smoke have enhanced ultraviolet absorption at 370 nm relative to 880 nm in two-wavelength aethalometer measurements. This enhanced absorption could serve as an indicator of wood burning particles. Two-wavelength (370 nm and 880 nm) aethalometer measurements were made at urban sites in Rochester, New York and Laredo, Texas from August 1 to December 31, 2009 and from December 23, 2007 to January 2, 2008, respectively. In Rochester, delta-C (UVBC370nm − BC880nm) values were higher by a factor of 3 during the night than during the day in November and December when residential wood burning was common. In Laredo, particularly high delta-C values were observed on Christmas Eve and New Year’s Eve and were attributed to biomass burning and firework emissions. Exponential decay was found to be a good estimator for predicting BC concentrations at different wind speeds regardless of wind directions.

Diurnal variations of BC

Diurnal variations of delta-C
Laboratory and Field Testing of an Automated Atmospheric Particle-Bound Reactive Oxygen Species Sampling-Analysis System
Journal of Toxicology. 2011, doi:10.1155/2011/419476. linkAbstract
In this study, various laboratory and field tests were performed to develop an effective automated particle-bound ROS sampling-analysis system. The system uses 2′ 7′-dichlorofluorescin (DCFH) fluorescence method as a nonspecific, general indicator of the particle-bound ROS. A sharp-cut cyclone and a particle-into-liquid sampler (PILS) were used to collect PM2.5 atmospheric particles into slurry produced by a DCFH-HRP solution. The laboratory results show that the DCFH and H2O2 standard solutions could be kept at room temperature for at least three and eight days, respectively. The field test in Rochester, NY, shows that the average ROS concentration was 8.3 (1SD=2.2) nmol of equivalent H2O2/m3 of air. The ROS concentrations were observed to be greater after foggy conditions. This study demonstrates the first practical automated sampling-analysis system to measure this ambient particle component.

Schematic diagram of the particle-bound ROS automated system
Impacts of the Canadian Forest Fires on Atmospheric Mercury and Carbonaceous Particles in Northern New York
Environmental Science & Technology. 2010, 44 (22), 8435-8440. linkAbstract
The impact of Canadian forest fires in Quebec on May 31, 2010 on PM2.5, carbonaceous species, and atmospheric mercury species was observed at three rural sites in northern New York. The results were compared with previous studies during a 2002 Quebec forest fire episode. MODIS satellite images showed transport of forest fire smoke from southern Quebec, Canada to northern New York on May 31, 2010. Back-trajectories were consistent with this regional transport. During the forest fire event, as much as an 18-fold increase in PM2.5 concentration was observed. The concentrations of episode-related OC, EC, BC, UVBC, and their difference (delta-C), reactive gaseous mercury (RGM), and particle-bound mercury (PBM) were also significantly higher than those under normal conditions, suggesting a high impact of Canadian forest fire emissions on air quality in northern New York. PBM, RGM, and delta-C are all emitted from forest fires. The correlation coefficient between delta-C and other carbonaceous species may serve as an indicator of forest fire smoke. Given the marked changes in PBM, it may serve as a more useful tracer of forest fires over distances of several hundred kilometers relative to GEM. However, the delta-C concentration changes are more readily measured.

MODIS satellite image taken on May 31, 2010, 1530 EDT
Long Term Characterization of Indoor and Outdoor Ultrafine Particles at a Commercial Building
Environmental Science & Technology. 2010, 44 (15), 5775-5780. linkAbstract
The particle number concentrations in the size range of 10−500 nm were measured inside and outside of a commercial building in Rochester, New York from 2005 to 2009. The indoor ventilation conditions were controlled by a heating, ventilation, and air-conditioning (HVAC) system. The overall average indoor and outdoor particle number concentrations were 2,166/cm3 and 5,214/cm3, respectively. Comparison of the indoor and outdoor ultrafine particles (UFP) distributions revealed that indoor sources contributed to the indoor UFP concentrations. The indoor/outdoor (I/O) ratio generally increased with particle size. The I/O ratios in the summer months were higher than those in the winter months. Indoor and outdoor correlations of particle concentrations were slightly weaker in warmer months. These results indicated that changes in the air exchange rates (AER) may have affected the correlation between indoor and outdoor UFP number concentrations. Moreover, indoor activities such as food preparation and cleaning may have contributed to the indoor UFP number concentrations.

Weekday diurnal variations of indoor and outdoor UFP number size distributions

Bird’s-eye view of the commercial building
Roadside Measurements of Ultrafine Particles at a Busy Urban Intersection
Journal of Air & Waste Management Association. 2008, 58 (11), 1449-1457. linkAbstract
A field sampling campaign on ultrafine particles (UFPs, diameter <100 nm) was conducted at a busy traffic intersection from December 2006 to June 2007 in Corpus Christi, TX. This traffic intersection consisted of South Padre Island Drive (SPID, Highway 358) and Staples Street. Traffic densities on SPID were 9,102/hr and 7,880/hr for weekdays and weekends, respectively. Staples Street traffic densities were 2,795/hr and 2,572/hr, respectively. There were approximately 3.7% heavy-duty diesel vehicles (HDDVs) on both roadways. Peak traffic flows occurred early in the morning and late in the evening during weekdays and around noon on weekends. The average UFP total number concentration collected by a condensation particle counter (CPC 3785; TSI) was 66,000/cm3. A direct relationship between the UFP number concentration and traffic density was observed, but the HDDV traffic density was found to be a better estimator of the UFP number concentration than total traffic density. A scanning mobility particle sizer (SMPS 3936 with DMA 3081 and CPC 3785, TSI) measuring the particle size distribution from 7 to 290 nm was rotated among four corners of the intersection. The upwind and downwind size distributions were both bimodal in shape, exhibiting a nucleation mode at 10-30 nm and a secondary mode at 50-70 nm. The highest and lowest particle concentrations were observed on the downwind and upwind sides of both roadways, respectively, indicating the importance of wind direction. Wind speed also played an important role in overall particle concentrations. UFP concentrations were inversely proportional to wind speed. A negative correlation was observed between particle number concentrations and ambient temperature. The particle number concentration was 3.5 times greater when traffic was idling at a red light than moving at a green light.

Locations of the sampling sites in Corpus Christi, TX

Instrumentation